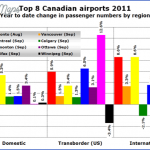
Airport traffic statistics suggest the nodal points of travel, the air travel transit points, and where the travel action is taking place. Here are the passenger traffic figures for major gateway cities in the non-communist world for 1981:
O’Hare, Chicago, 111. 37,992,151
Los Angeles, Ca. 32,722,534
Heathrow, London 27,512,945
Kennedy, N.Y. 25,533,929
Tokyo Haneda 21,235,185
Miami, Fla. 19,848,593
San Francisco, Ca. 19,848,491
Osaka, Japan 17,087,548
Orly, Paris, France 17,012,241
Frankfort, Germany 16,953,045
Toronto, Canada 14,512,400
Honolulu, Hawaii 14,344,225
Mexico Int’l 12,961,727
Fiumicino, Rome, Italy 10,923,564
Gatwick, London, Eng. 9,885,847
Schiphol, Amsterdam 9,668,976
The maps on pages 12 and 13 show the major airports of the world. They are both destinations and transit points. Studying these maps is a good way to familiarize oneself with the world’s travel grids.
Whereas travel other than by air can take days, air travel is figured at something like five hundred miles per hour, once a plane leaves the airport. Looking at the air distances between major cities as seen on page 14, travel times between cities can be estimated. The distance between New York and London is seen as 3,473 miles. Dividing by five hundred gives a flight time of close to seven hours. Flight times going east are usually shorter than flying west. Airlines take advantage of the jet streams that flow west to east. Airliners flying west usually are slowed down by the jet streams.
MAJOR AIRPORTS TRAFFIC FIGURES Photo Gallery
Maybe You Like Them Too
- Explore East Lindfield, Australia with this detailed map
- Explore Bonferraro, Italy with this detailed map
- Explore Doncaster, United Kingdom with this detailed map
- Explore Arroyito, Argentina with this Detailed Map
- Explore Belin, Romania with this detailed map


